Nebulous Performance Analysis
- Nebulous Performance Analysis
-
Study over all available logs
- <Feature> vs Epoch
- <Feature> vs <Feature>
-
Study of Dependencies of Nebulous Specific Request vs MySQL Slow Query
- Are the count of MySQL Slow Statements and Nebulous "Create" …
- Are the count of MySQL Slow Statements and Nebulous "Delete" …
- Are the count of MySQL Slow Statements and Nebulous "Fail Stat" …
- Are the count of MySQL Slow Statements and Nebulous "Find Instance" …
- Are the count of MySQL Slow Statements and Nebulous "Stat" statements …
The goal of this page is to give some details about the Nebulous performance computation.
Framework and Tools
The tools for analysis come from https://svn.pan-starrs.ifa.hawaii.edu/repo/ipp/trunk/tools/log_parsing. Namely, the script called nebulous_activity.py is run (its argument being the name of the directory where the Apache logs are stored. The script logs what it is doing on /dev/stderr and its results on /dev/stdout. Under bash, the best is therefore to run it this way:
python ./nebulous_activity.py > results 2> execution.log
so that the execution can be more easily monitored.
The results are not sorted (by date). This can be done by: sort results > results.sorted. The results output format is a SSV (Space Separated Values) file organized in lines (end of line is \n). A result line starts by a timestamp (e.g. 2011-02-13T21:40:00) and numbers detailing the Apache/Nebulous activity during the 10 minutes following the timestamp (that is what happened between 2011-02-13T21:40:00 and 2011-02-13T21:49:59+(1-epsilon)). The first number is the total of Nebulous related messages in the access_log; the second one is the number of entries in the error_log; the third is the number of Nebulous create requests messages, the fourth is the number of find_instance requests; the fifth is the number of delete requests; the sixth is the number of fail_stat requests; the seventh of stat requests; the eighth the Nebulous unknown request (hence the first number is the sum of columns 3 to 8); the last/ninth column is the count of non-Nebulous requests.
Typical line: <timestamp>_<Nebulous requests>_<Apache errors>_<Create>_<Find Instance>_<Delete>_<Fail Stat>_<Stat>_<Other Nebulous>_<Non Nebulous>
Gnuplot index:     1               2                 3            4          5             6        7          8          9                10
- The underscore is a more visual representation of a space (0x20)
- <timestamp> is in ISO8601 format YYYY-MM-DDTHH:MM:SS. The utility convert_date_iso_to_epoch.py (in the same SVN repository) can be used to convert it to YYYYMMDDHHMMSS, that is, an integer value chronologically ordered that can be used as an input value for gnuplot).
- <Apache errors> can sometimes be -1. It means either that no data was available, or that there was no entry in the error_log file for the 10-minute sampling period. The distinction is not made because 1) it will require to add more code (I let you guess all the cases that may occur); 2) once plotted, the average human will not mage any difference between -1 and 0 (specially when values as large as 1000 are drawn).
Note: parsing log files can last LONG (Rule of the thumb 1 hour for 1 million lines for ippc00 (RAM 32G/IntelXeon 2.4Ghz, cache 6M, no RAID?). If you find the law, write it down)
Note: I have to mention the existence of apachelog which is a suite of Python utilities to parse Apache log files. I did not used it because we are not interested in details of Apache (e.g. hosts where the requests come from) but in Nebulous activity. If one day, we need more details, think about using it.
Input Data: Case Study 2011-01-31 to 2011-02-15
I took data from the current ippdb00:/var/log/apache2/ directory, where current means 2011-02-15T16:18:59). The directory contains access and error logs for the period 2011-01-31T16:20:04 to current date. Six files are interesting for us, 3 access_log files and 3 error_log files:
- access_log (2084564561 = ~2G bytes): 26294806 = 26M lines; from 14/Feb/2011:10:22:29 to 15/Feb/2011:16:18:59;
- access_log-20110211.gz (828543325 bytes): from ; 216789642=217M lines
- access_log-20110214.gz (176265546 bytes): 46813199=47M lines
- error_log (1346265 bytes): 15350 lines; from Mon Feb 14 10:22:29 to Tue Feb 15 16:19:05 2011;
- error_log-20110211.gz (353396 bytes): 139075 =~ 139k lines
- error_log-20110214.gz (438683 bytes): 981899 =~ 982k lines
(File stats for gziped files: for f in *.gz; do echo -n "$f: "; zcat $f | wc -l; done)
Plots were made using gnuplot (see attached file [instructions.gnuplot]).
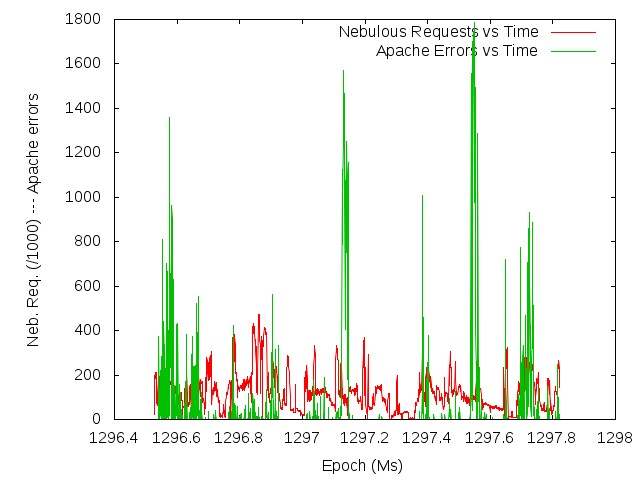
Nebulous Requests and Apache Errors vs Time / Nebulous Requests vs Apache Errors
 | 
|
| Comment here | Comment here |
There is no (visible) correlation between the Nebulous activity and the number of Apache errors.
Nebulous Requests and Apache Errors vs Time (time interval centered around maximal errors count time frame)
Plots for 2011-02-12T08:40:00 --- 2011-02-12T17:30:00. The maximal count of errors (1788) was reached for 2011-02-12T12:20:00, that is, (roughly) the center of the interval.


It seems there is an inverse correlation between the Non-Nebulous Apache activity and the number of Apache errors. Weird!
Study over all available logs
The following figures show the information. They were generated with the generate_gnuplot_script.py, the template.gnuplot, and the results.bz2 files.
Apache logs files are located in:
- ippdb00:/var/log/apache2
- ippdb00:/export/ippdb00.0/apache_logs.old
- ipp031:/export/ipp031.0/watersc1/nebulous_analysis/
MySQL slow queries log file is ippdb00:/var/log/mysqld/mysqld.slow.log
<Feature> vs Epoch
How did the Apache Errors count evolve with time?

How did the MySQL Slow Statements count evolve with time?

How did the "known" Nebulous Statements count evolve with time?

How did the "other" (i.e. not-"known") Nebulous Statements count evolve with time?

How did the Non-Nebulous Requests count evolve with time?

<Feature> vs <Feature>
Is Apache Errors count related to the set of "known" Nebulous Statements?

Is Apache Errors count related to the count of MySQL Slow Statements?

Is Apache Errors count related to the count of Other Nebulous Statements?

Is Apache Errors count related to the count of Non-Nebulous Requests?

Study of Dependencies of Nebulous Specific Request vs MySQL Slow Query
Are the count of MySQL Slow Statements and Nebulous "Create" statements related?

Are the count of MySQL Slow Statements and Nebulous "Delete" statements related?

Are the count of MySQL Slow Statements and Nebulous "Fail Stat" statements related?

Are the count of MySQL Slow Statements and Nebulous "Find Instance" statements related?

Are the count of MySQL Slow Statements and Nebulous "Stat" statements related?

Attachments (23)
- apacheErrors_and_nebulousRequests_vs_Time.jpg (53.5 KB ) - added by 15 years ago.
- apacheErrors_and_nebulousRequests_vs_time_local.jpg (47.5 KB ) - added by 15 years ago.
- apacheErrors_vs_nebulousRequests.jpg (54.9 KB ) - added by 15 years ago.
- apacheErrors_and_otherNebulousRequests_vs_time_local.jpg (49.4 KB ) - added by 15 years ago.
- apacheErrors_and_NonNebulousRequests_vs_time_local.jpg (46.9 KB ) - added by 15 years ago.
- instructions.gnuplot (2.7 KB ) - added by 15 years ago.
- total_ApacheErrors_vs_Epoch.jpg (66.0 KB ) - added by 15 years ago.
- total_ApacheErrors_vs_KnownNebulous.jpg (80.0 KB ) - added by 15 years ago.
- total_ApacheErrors_vs_MySQLSlowQueries.jpg (97.6 KB ) - added by 15 years ago.
- total_Create_vs_MySQLSlowQueries.jpg (100.0 KB ) - added by 15 years ago.
- total_Delete_vs_MySQLSlowQueries.jpg (97.7 KB ) - added by 15 years ago.
- total_FailStat_vs_MySQLSlowQueries.jpg (56.9 KB ) - added by 15 years ago.
- total_KnownNebulousRequest_vs_Epoch.jpg (56.8 KB ) - added by 15 years ago.
- total_MySqlSlowQueries_vs_Epoch.jpg (139.6 KB ) - added by 15 years ago.
- total_NonNebulousRequest_vs_Epoch.jpg (73.9 KB ) - added by 15 years ago.
- total_NonNebulous_vs_MySQLSlowQueries.jpg (119.8 KB ) - added by 15 years ago.
- total_OtherNebulousRequest_vs_Epoch.jpg (45.0 KB ) - added by 15 years ago.
- total_OtherNebulous_vs_MySQLSlowQueries.jpg (79.3 KB ) - added by 15 years ago.
- total_Stat_vs_MySQLSlowQueries.jpg (95.1 KB ) - added by 15 years ago.
- total_FindIns_vs_MySQLSlowQueries.jpg (106.2 KB ) - added by 15 years ago.
- results.bz2 (397.5 KB ) - added by 15 years ago.
- generate_scripts.py (5.1 KB ) - added by 15 years ago.
- template.gnuplot (370 bytes ) - added by 15 years ago.
Download all attachments as: .zip