DRAVG test on SN 2009kf photometry (MT Botticella)
We are working on photometry of the the SN PS1-0609001 (2009kf) and we have been looking at the newly released MD08 images (stacks for each epoch) and also are comparing them with the new, seasonal stack of the good images released by Heather.
The main problem is the masking in the nightly stacks that Paul has given us, compared what seems possible given Heather's new stacks. Example comparison is :
Left : the seasonal stack made by Heather (MD08.skycell.102.stk.29916.fits) with 41 input images. All NaN pixels are set to red. This looks good, brightest stars have saturated cores as expected. Virtually no other pixels are masked as NaN in these images. In fact apart from the butterfly effect these stacks look very good. On the right is an example from one of Paul's nightly stacks (MD08.skycell.102.stk.25151.fits) with 9 input images. Many more stars are masked, and also bad chip areas are still visible, despite there being 9 input images. This is a similar problem to that noted by Durham in their (Durham_MDS_Testing3)

Some more severe masking is seen below :
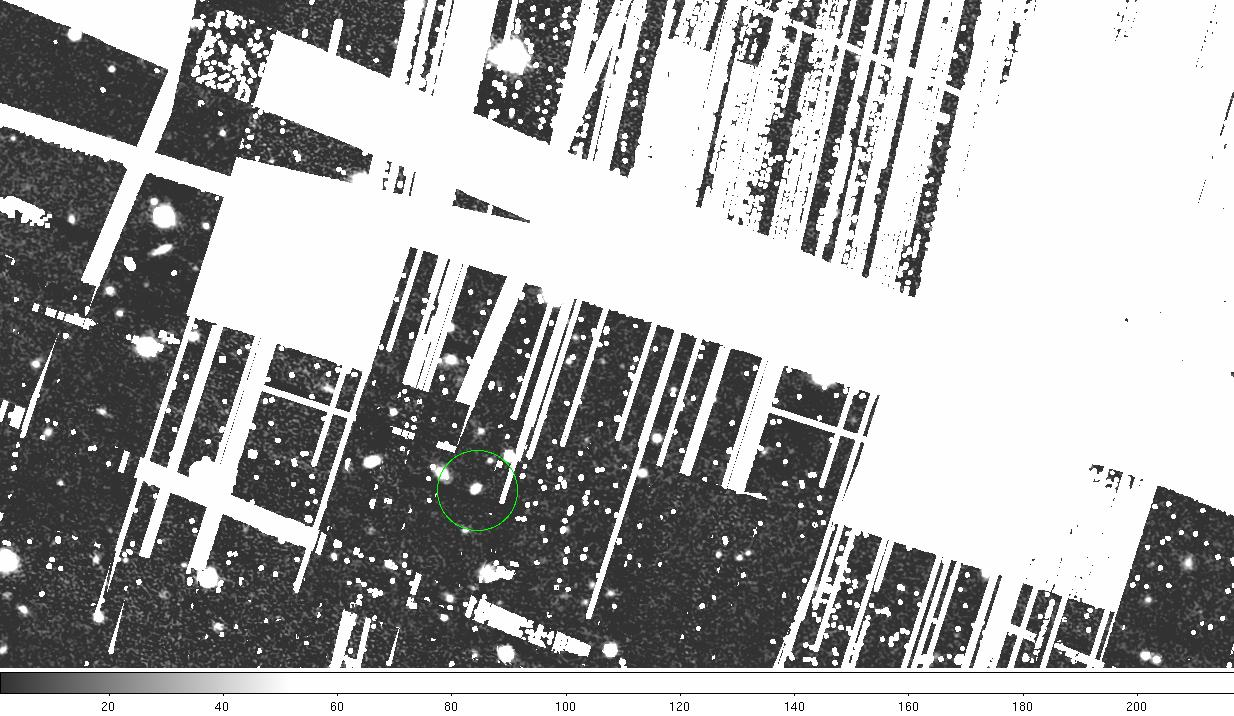
masked areas
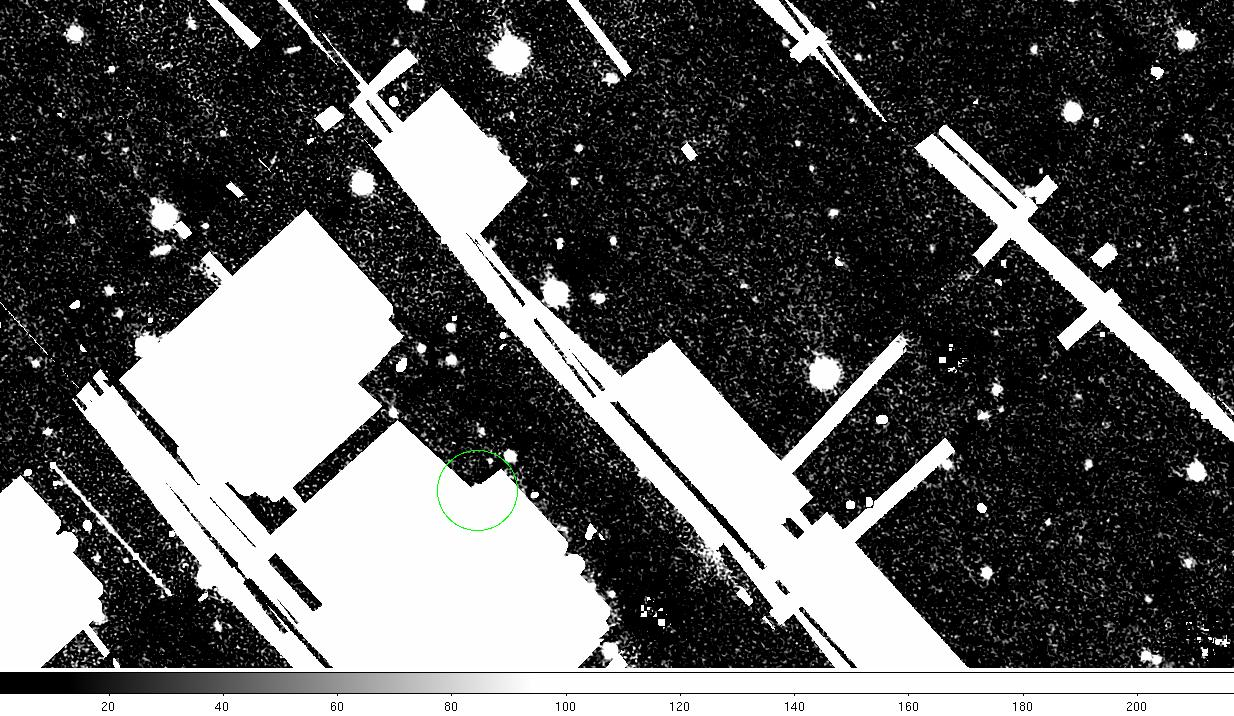
the stacks have a lot of masked areas and sometimes the SN host galaxy is hidden (the SN host galaxyin the green circle).


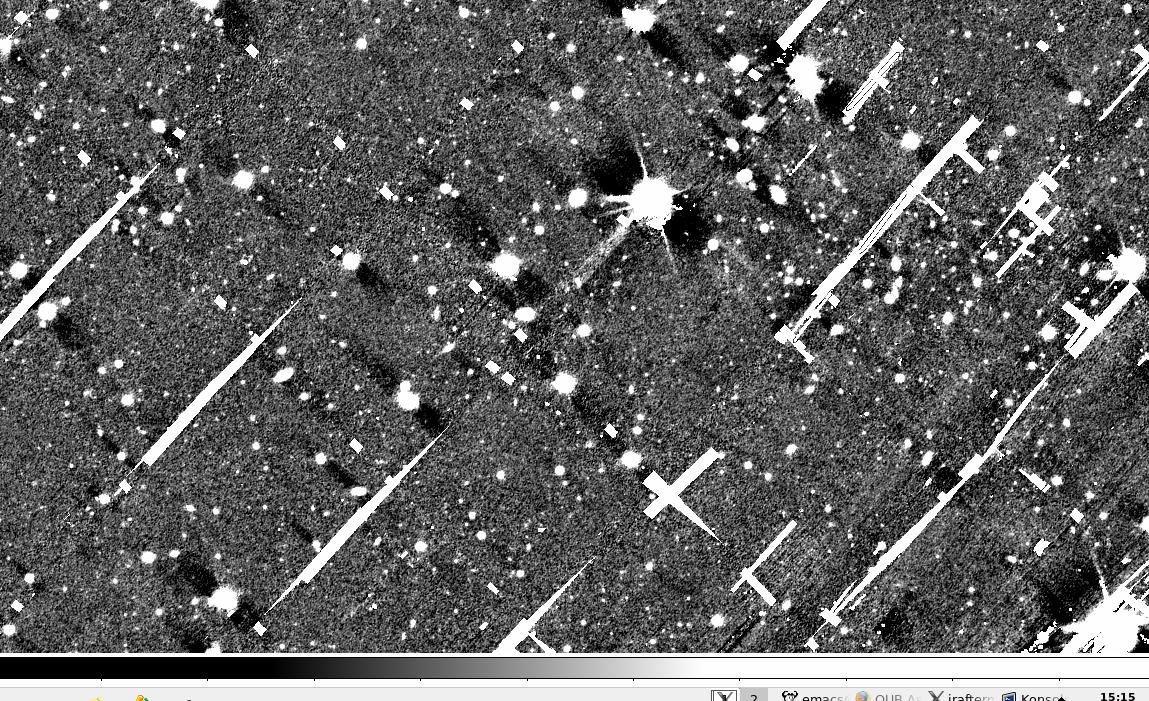
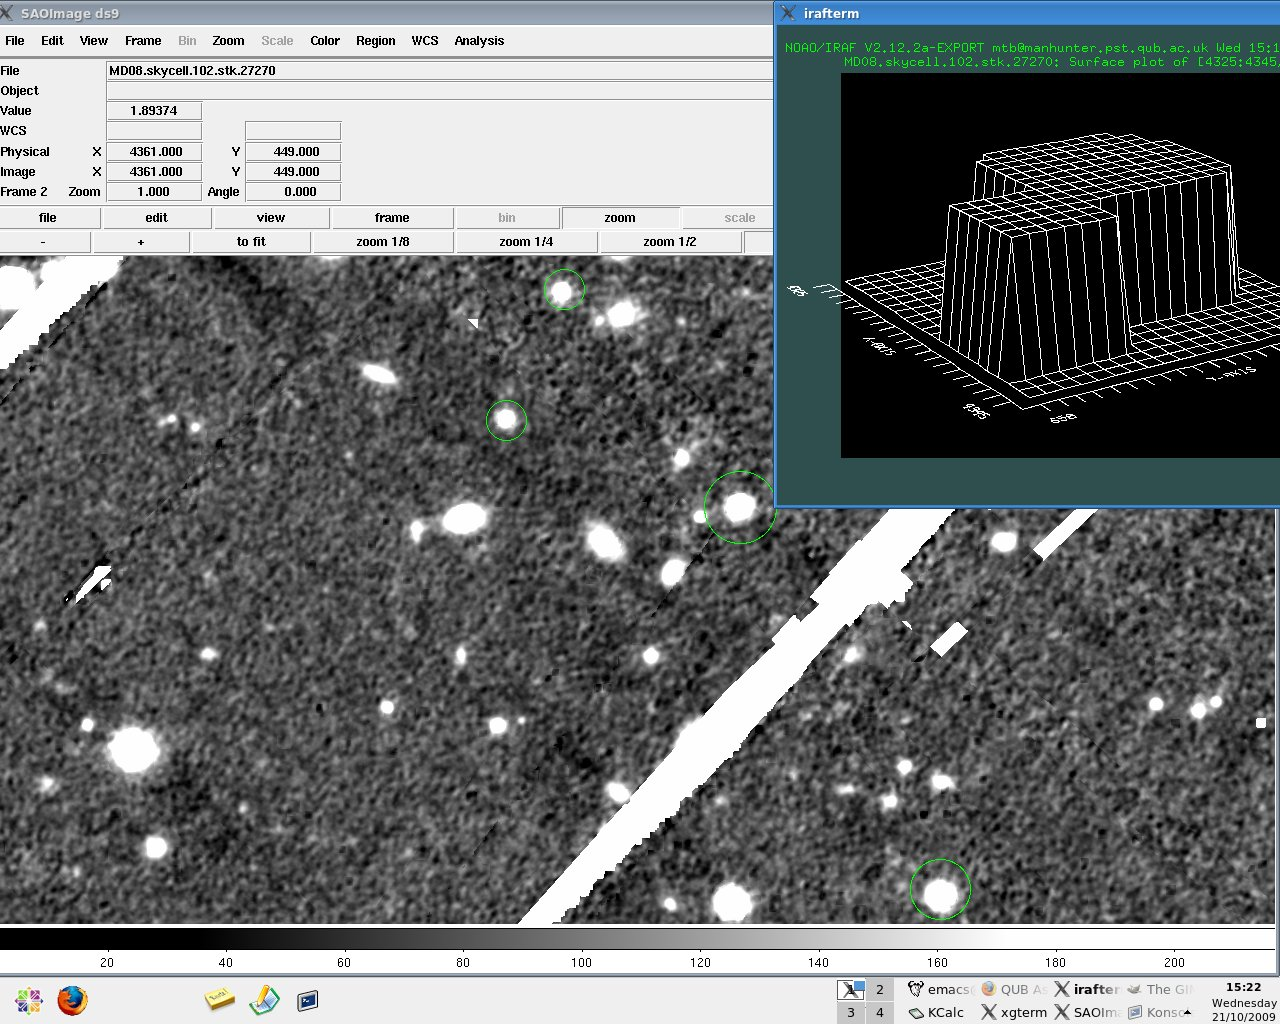
If you look at some of the not saturated stars (for example the green ringed stars in fig Stars_ppStack.png) they have mask "blocks" sitting on top of them. The masks are not symmetrical, nor simply on the highest pixel value, but are irregular shapes, sitting over part of the psf.

These were several of the comparison stars for the SN photometry and we can not use them to calibrate the SN mag. There are masked areas all over the images. These masks are mostly (but not always) associated with moderately bright stars.
background
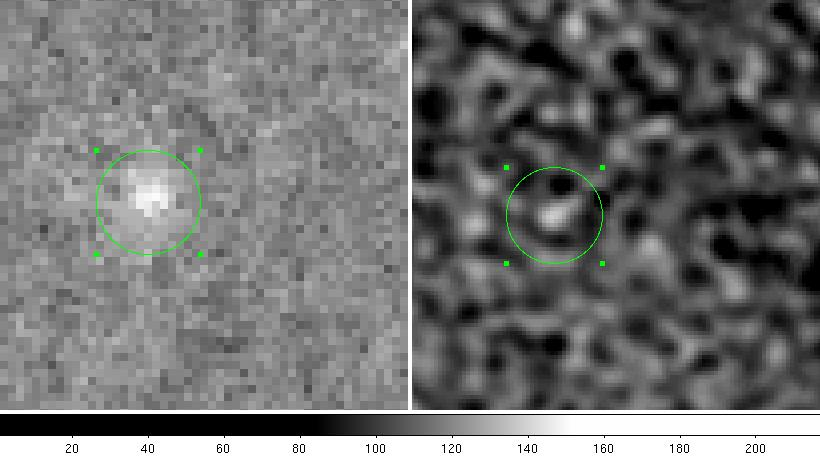
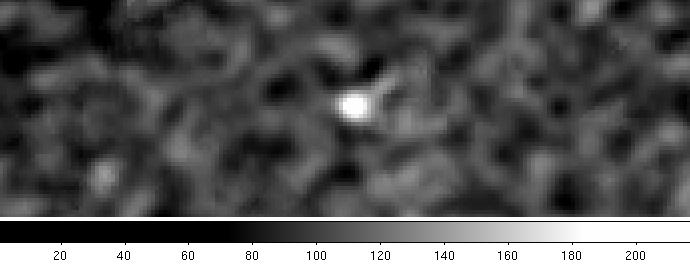
We are using the template subtraction technique to remove the signal of the host galaxy. The SN residual on difference image is nice but it is impossible to obtain an accurate measurement because of the background around the residual.

We collected some images from the Liverpool telescope and you can see the two difference images obtained with the same procedure (right images from the LT (stacked with IRAF) left images from PS1 (stacked with IPP).

We also found a bigger scatter between the zero points in the PS1 images with respect the LT images. Here some numbers relative to the same sequence stars
13/10/09 z band  LT

    id fwhm  ph_mag  fit_mag  fiterr zp

   1  5.0   -4.379  -4.589  0.007 22.43
   2  5.0   -2.990  -2.858  0.025 22.41
   5  5.0   -5.597  -5.613  0.005 22.42
   6  5.0   -5.043  -5.092  0.005 22.40
   7  5.0   -5.350  -5.418  0.004 22.41
   8  5.0   -5.168  -5.287  0.005 22.41
PS1 (target and template are obtained stacking 8 PS1 images)

16/06/09 z band

  id fwhm  ph_mag  fit_mag  fiterr zp

   1  7.0   -6.42  -6.45  0.006 24.30
   2  7.0   -4.63  -4.62  0.006 24.10
   5  7.0   -7.47  -7.49  0.003 24.29
   6  7.0   -6.89  -6.91  0.002 24.15
   7  7.0   -8.28  -7.19  0.003 24.19
   8  7.0   -7.1   -7.13  0.003 24.25
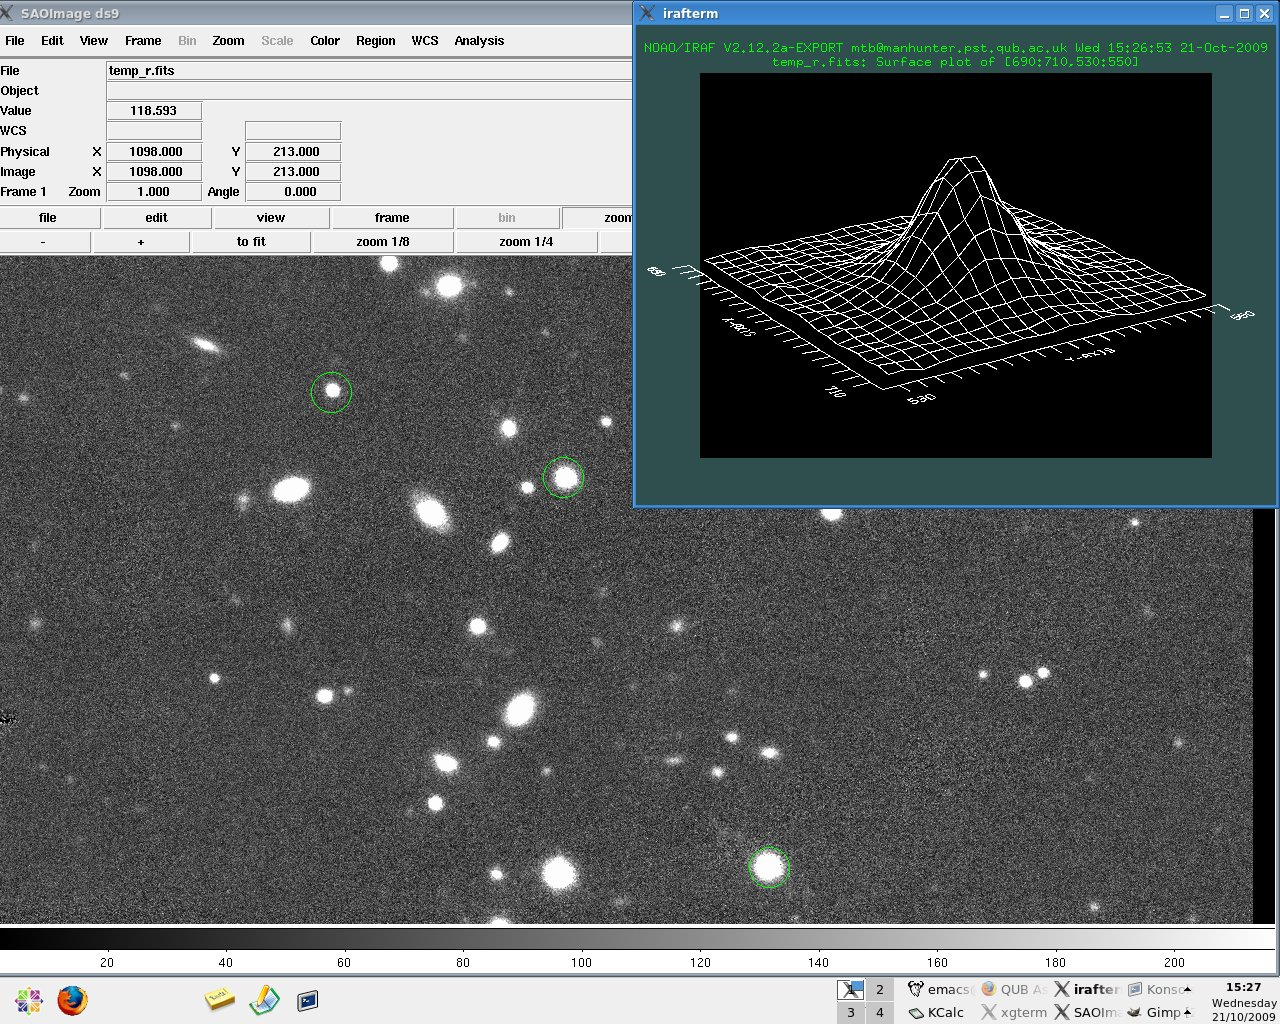
We tried to combine the warps available with IRAF and to obtain some measurements on these new stacks. In this case the measure is easier and the scatter is reduced.
PS1 (target and template images are obtained stacking warps with IRAF)

130609 z band

     id fwhm  ph_mag  fit_mag  fiterr zp

   1  6.2   -6.466  -6.544  0.011 24.38
   2  6.2   -4.657  -4.739  0.019 24.22
   5  6.2   -7.451  -7.554  0.011 24.36
   6  6.2   -6.783  -6.962  0.011 24.27
   7  6.2   -7.892  -7.288  0.011 24.28

160609 z band

   id fwhm  ph_mag  fit_mag  fiterr zp

   1  6.9   -6.421  -6.395  0.007 24.23
   2  6.9   -4.402  -4.614  0.018 24.09
   5  6.9   -7.453  -7.405  0.005 24.21
   6  6.9   -6.871  -6.828  0.005 24.18
   7  6.9   -7.158  -7.151  0.006 24.14
   8  6.9   -7.107  -7.070  0.006 24.19
Attachments (8)
- SN2009kf.png (175.5 KB ) - added by 17 years ago.
- SNres.png (84.5 KB ) - added by 17 years ago.
- stacks.png (1.4 MB ) - added by 17 years ago.
- stacks_2.png (691.1 KB ) - added by 17 years ago.
- stacks_3.png (963.1 KB ) - added by 17 years ago.
- Stars_ppStack.png (829.2 KB ) - added by 17 years ago.
- Stars_imcombine.png (1.3 MB ) - added by 17 years ago.
- MD08-Heather-Paul-comp.jpg (510.9 KB ) - added by 17 years ago.