PS1 Photometric System
This is a compendium of all the information for Pan-STARRS 1 bandpasses assembled by John Tonry. The version is 2010-10-28.
PLEASE NOTE THAT THIS WIKI IS OUT OF DATE! There is an ApJ paper (published 2012) which should be used, not what follows here.
- ApJ paper : http://adsabs.harvard.edu/abs/2012ApJ...750...99T or http://iopscience.iop.org/0004-637X/750/2/99
- The current filter bandpasses are available from our data distribution server: http://ipp.ifa.hawaii.edu/ps1.filters
(2010-10-28 version of bandpasses: do not use!! use the APJ paper)
The primary sources of information are rebinned onto a uniform 1nm table, which is then integrated against various SEDs to get color terms and zero points.
Derivation of bandpasses and throughputs
The program "homogenize" creates two files that assemble all of the various pieces of information onto the uniform, 1nm wavelength scale.
 ps1.phot     - transmissions of system and filters
 ps1.zp       - sensitivities in each filter
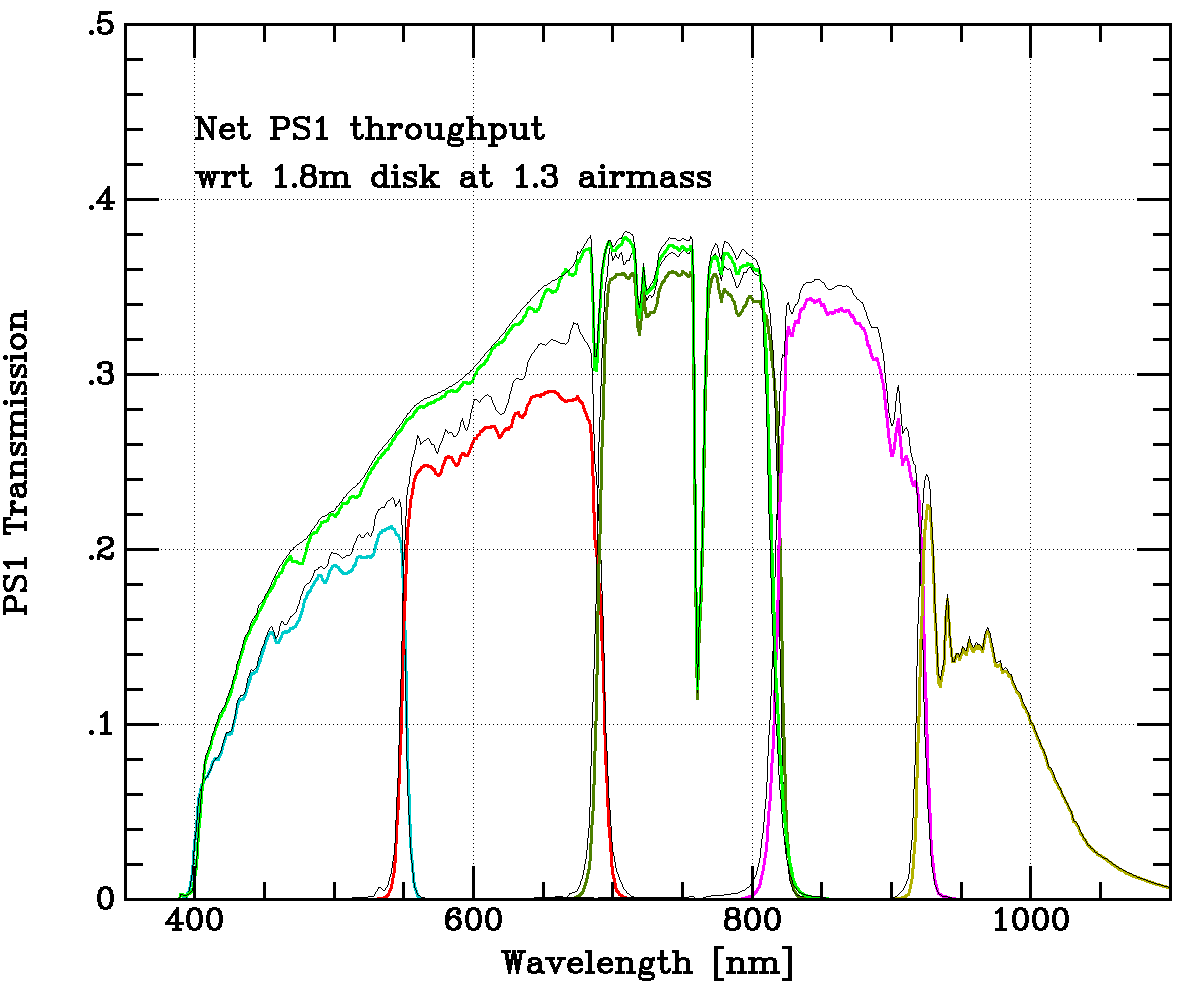
 ps1.bandpass - net throughput in each bandpass relative to unobscured 1.8m
 ps1.oob      - filter reflection and out-of-band transmission (not very useful)
The columns in ps1.phot are
 wave     - wavelength [nm]
 scatt    - atmospheric scattering loss per airmass, probably KPNO
 molec    - atmospheric absorption loss per airmass, probably CTIO
 airglow  - dark sky airglow [ph/sec/m^2/nm/arcsec^2]
 alum     - reflectivity of PS1 aluminum, per surface (2 total)
 AR       - transmission of PS1 AR coatings, per surface (6 total)
 QE-80    - PS1 OTA QE, set to -80C
 CCD_AR   - PS1 OTA reflectivity
 Tput     - PS1 system total throughput, measured by laser, no filter, no atm
 Barr:    - Average transmissions measured by Barr for 6 filters
 laser:   - Average transmissions measured in situ by laser for 6 filters
where the laser throughput is the ratio of the signal measured when filter was in place to the signal when it was out of the beam.
Given this, we should expect to see (and do find)
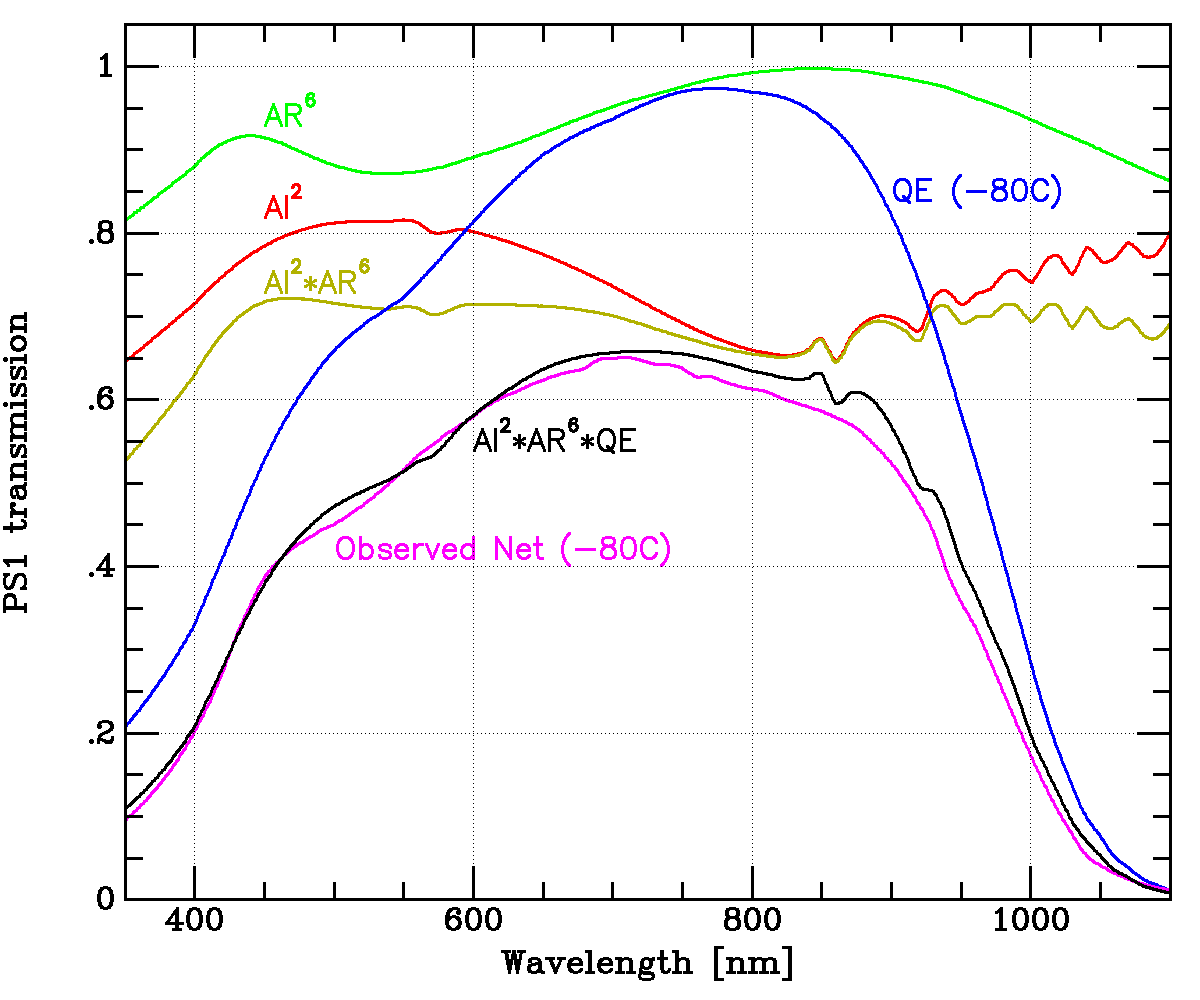
Tput ~ alum^2 * AR^6 * QE
The laser measurement did not have any means to put an absolute scale on throughput, so "Tput" is adjusted to match this product. It is reassuring that this simultaneously gives zeropoints for the entire system that match SDSS-derived zero points quite well.

There are distinct differences between the laser-derived filter bandpasses and those measured by Barr: the laser red side is a bit brighter and the laser throughputs are higher. Inasmuch as the throughputs are simply laser through filter divided by laser without filter, we are at a loss to understand why this difference occurs, but we worry about things like extra scattered light that is far out of focus and therefore does not contribute to a star-based sensitivity, or possibly a non-filled pupil that traverses the AR coating at a non-representative set of angles.

On the other hand, we find that the SDSS-based zero points have an 0.1 mag trend from g to y when we use (alum2 * AR6 * QE) and it is not present for Tput. Here we worry about the accuracy of the aluminum and AR coating traces. (For example the wiggles measured in the Al come from the overcoat, but do not appear in Tput, suggesting that the overcoat may not have a uniform thickness over the full aperture.)
Therefore our best guess at the system response is (Tput*Barr_filter), and that is what is used for ps1.zp and ps1.bandpass.

The photons collected from a source of AB=0 in a bandpass dln_nu should be
ZP = 5.48e6 ph/cm^2/sec/ln_nu * Aeff * dln_nu * (scatt*molec)**secz * Tput * Barr_filter
where
Aeff = (1-VIGNETTE) * pi/4 * (180cm)^2, VIGNETTE ~ 0.35
The zeropoints derived for PS1 listed in ps1.phot are (secz = 1.3):
 Filt   weff    FWHM   sigma    Q       ZP   ZP-SDSS
   g     483      99  0.0870  0.0769   24.61   -0.01
   r     619      98  0.0672  0.0965   24.85    0.01
   i     752      90  0.0509  0.0912   24.79    0.01
   z     866      72  0.0352  0.0592   24.32   -0.01
   y     971      89  0.0391  0.0248   23.38   -0.01
   w     609     267  0.1866  0.2940   26.06    0.35 (bogus, see below)
   o     652     379  0.2471  0.4035   26.41    0.25 (bogus, see below)
The "ZP-SDSS" column here comes from a comparison of guide star fluxes with magnitudes from 2MASS on the SDSS system. The w and o magnitudes were simply taken to be i band, incurring an error that we can now correct. Note that this is calculated for a CCD temperature of -80C. If the CCDs were warmed to -60C the y band ZP would increase by 0.1 magnitude to 23.48.
We follow Fukugita 1996,
  S(nu)  = 5.48e6 [ph/cm^2/sec/ln_nu] * Aeff *
                            (scatt*molec)**secz * Tput * Barr_filter
  weff  = exp[ int(dln_nu S(nu) lnlam) / int(dln_nu S(nu)) ]
  sigma = sqrt[ int(dln_nu S(nu) (lnlam/weff)^2) / int(dln_nu S(nu)) ]
  Q     = int(dln_nu S(nu))
  ZP    = 2.5 log[ Q ]  + 27.40
        = 2.5 log[ int(dln_nu 5.48e6 ph/cm^2/sec/ln_nu * Aeff *
                            (scatt*molec)**secz * Tput * Barr_filter) ]

    NB: 48.60 = 2.5log(h[cgs]*5.48e6)
Note that these are dimensionless bandpasses, so AB magnitudes are obtained for a source of flux f_nu [cgs] as
m = -2.5 log[ int(dln_nu S(nu) f_nu) / int(dln_nu S(nu)) ] - 48.60
Please do *not* confuse with bandpasses traditionally presented as a weighting function for an energy integral. The "starphot" program uses the energy weighting only for the BVRI magnitudes.
As with SDSS, Pan-STARRS defines its filter system at a standard airmass of 1.3.
Synthetic photometry and colors
The program "starphot" assembles all sorts of filter bandpasses (Bessel BVRI and synthetic JHKs, SDSS, and Pan-STARRS1 as described above), all sorts of stellar SEDs (Gunn&Stryker, STScI calspec standards, and SPEX MLT dwarf standards), and calculates magnitudes.
The result in starphot.out lists
  Star     - running index
  Name     - star name
  Sptype   - ascii spectral type
  Type     - spectral type: O0 = 1.0 through T9 = 9.9 (-1 for no type)
  L        - luminosity class, 1-5 and 10 for white dwarf
  V        - cataloged apparent V magnitude (except Sun is absolute)
  H        - cataloged apparent H magnitude
Then columns for magnitudes and uncertainties:
  Johnson/Bessel:  B, V, R_KC, I_KC, J, H, Ks

  SDSS:            u_SDSS, g_SDSS, r_SDSS, i_SDSS, z_SDSS

  PS1:             g_PS1, r_PS1, i_PS1, z_PS1, y_PS1, w_PS1, o_PS1
(o_PS1 is "open", i.e. no filter). Note that 99.99 is used for a non-calculated magnitude (SED didn't overlap bandpass) and 9.99 is used for a completely uncertain magnitude (ditto).
From this output file, we derive two equations for w_PS1 and o_PS1 magnitudes that can be used for assigning guide star magnitudes (and therefore extinctions when these filters are in):
  (w-r) = 0.05 + 0.18 (r-i) - 0.47 (r-i)^2

  (o-r) = 0.08 - 0.08 (r-i) - 0.96 (r-i)^2
Prior to this the w_PS1 and o_PS1 guide star magnitudes were simply being set to the i magnitude, therefore incurring the "ZP-SDSS" magnitude errors above from a typical star color of (r-i)=0.25.
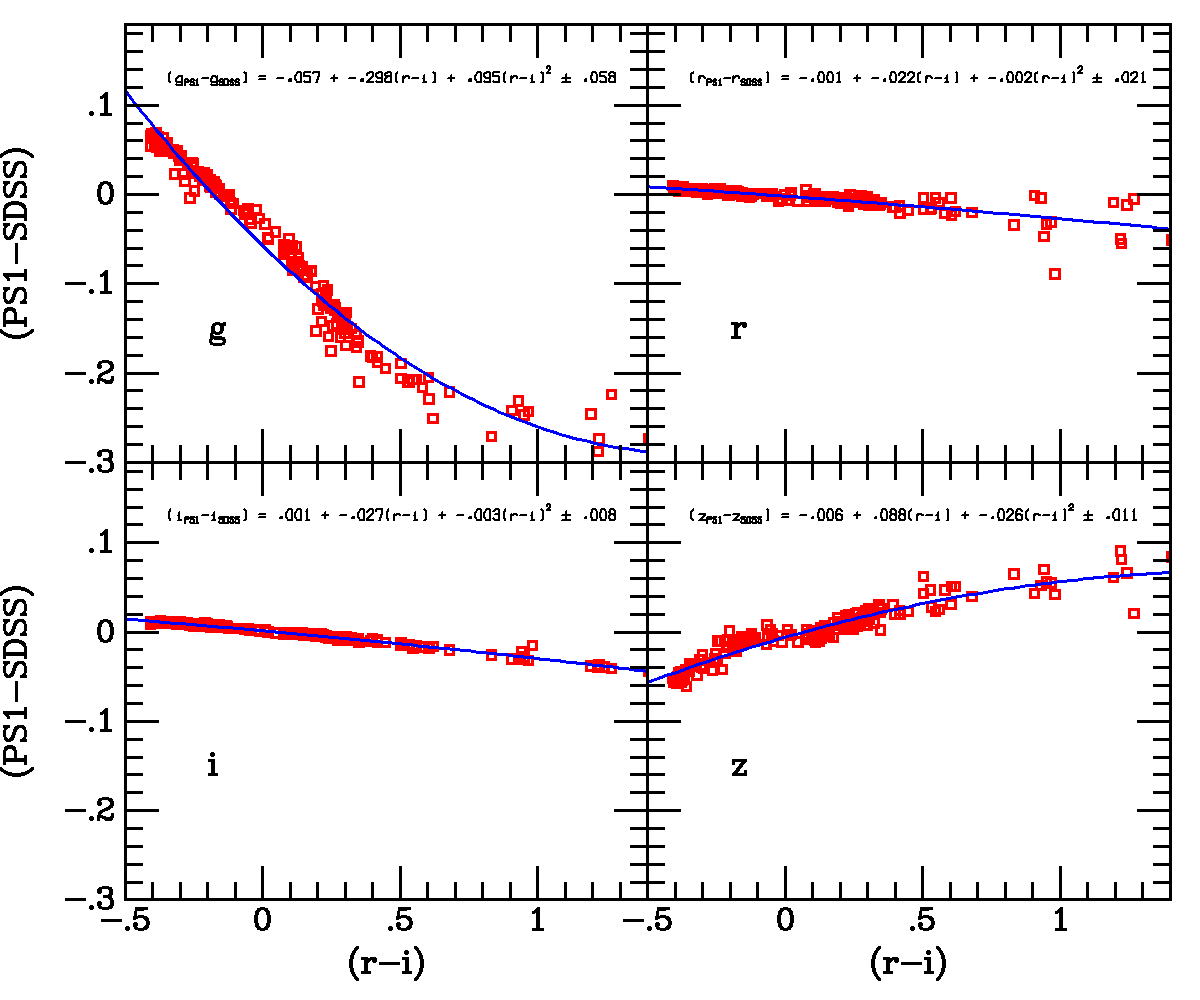
As an example of what can be gleaned from starphot.out, here is a plot that shows the comparison between PS1 and SDSS magnitudes as a function of (r-i). Note that the PS1 g filter is distinctly redder than that of SDSS (partially because the SDSS CCDs have better 400nm QE than PS1 and partly because PS1 did not feel the need to exclude the 5577 and 5460 sky lines), the PS1 z filter is distinctly bluer than SDSS (because it is cut off on the red side and picked up by the y filter), and the PS1 r and i filters are very close to SDSS.

Detailed source directories
The full directory of all information is found in PS1_PHOT.tar.bz2. Within it the directory Etc has typical atmospheric extinction functions and OH emission, the Bessel directory contains the BVRI bandpasses from Bessel (199), the SDSS directory has the SDSS bandpasses, and the Std_star directory has spectral energy distributions from Gunn&Stryker (augmented to the IR by Bruzual and Persson), the STScI Calspec standards, and the SPEX cool dwarf standards.
****************************************************************
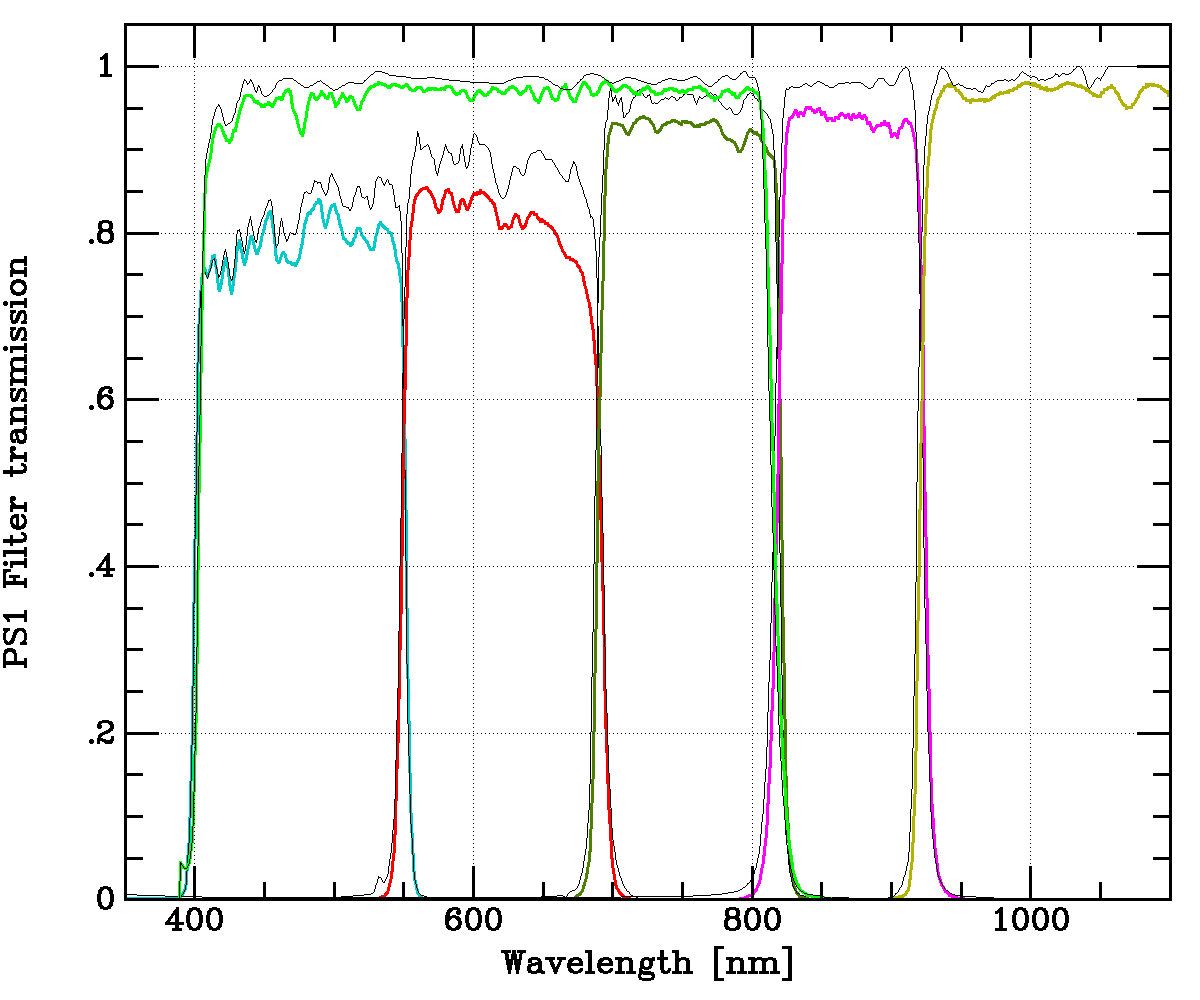
These are the various filter curves measured by Barr,
in the PS1_trans directory

  Note: y2 is the original 975-1025 bandpass filter
        y3 (or y) is the new 925 long-pass filter

PS_filter.g              - Extract from Barr spreadsheet of g transmission
PS_filter.r              - Extract from Barr spreadsheet of r transmission
PS_filter.i              - Extract from Barr spreadsheet of i transmission
PS_filter.z              - Extract from Barr spreadsheet of z transmission
PS_filter.y              - Extract from Barr spreadsheet of y3 transmission
PS_filter.w              - Extract from Barr spreadsheet of w transmission
PS_filter.y2             - Extract from Barr spreadsheet of y2 transmission

PS_filter_oob.g          - Extract from Barr spreadsheet of g out of band transmission
PS_filter_oob.r          - Extract from Barr spreadsheet of r out of band transmission
PS_filter_oob.i          - Extract from Barr spreadsheet of i out of band transmission
PS_filter_oob.z          - Extract from Barr spreadsheet of z out of band transmission
PS_filter_oob.y          - Extract from Barr spreadsheet of y3 out of band transmission
PS_filter_oob.w          - Extract from Barr spreadsheet of w out of band transmission
PS_filter_oob.y2         - Extract from Barr spreadsheet of y2 out of band transmission

PS_filter_refl.g         - Extract from Barr spreadsheet of g second surface reflection
PS_filter_refl.r         - Extract from Barr spreadsheet of r second surface reflection
PS_filter_refl.i         - Extract from Barr spreadsheet of i second surface reflection
PS_filter_refl.z         - Extract from Barr spreadsheet of z second surface reflection
PS_filter_refl.y         - Extract from Barr spreadsheet of y3 second surface reflection
PS_filter_refl.w         - Extract from Barr spreadsheet of w second surface reflection
PS_filter_refl.y2        - Extract from Barr spreadsheet of y2 second surface reflection

In the XLS directory:
---------------------
gbandRAWDATA.xls.bz2     - Spreadsheet from Barr with g filter transmission, etc
rbandRAWDATA.xls.bz2     - Spreadsheet from Barr with r filter transmission, etc
ibandRAWDATA.xls.bz2     - Spreadsheet from Barr with i filter transmission, etc
zbandRAWDATA.xls.bz2     - Spreadsheet from Barr with z filter transmission, etc
y3bandRAWDATA.xls.bz2    - Spreadsheet from Barr with y3 filter transmission, etc
wbandRAWDATA.xls.bz2     - Spreadsheet from Barr with w filter transmission, etc
y2bandRAWDATA.xls.bz2    - Spreadsheet from Barr with y2 filter transmission, etc
****************************************************************
****************************************************************
This is the AR coating on the lenses (6 surfaces total) from Infinite Optics
in the PS1_trans directory

PS_lens.ar               - reflectivities of PS1 lens AR coatings, per surface.
****************************************************************
****************************************************************
These are the reflectivity of the M1 and M2 coatings (provenance uncertain)
in the PS1_trans directory

  Note: M2 originally had a silver coating that degraded quickly and badly so
        it was replaced with aluminum, presumably the same as M1.

PS_m1_al.xls.bz2         - vendor supplied spreadsheet of M1 aluminum reflectivities
PS_m2_ag.xls.bz2         - vendor supplied spreadsheet of M2 silver reflectivities

PS_m1.al                 - extract of aluminum of M1 from spreadsheet
PS_m2.ag                 - extract of silver of M2 from spreadsheet
PS_m12.refl              - extracts of M1 aluminum, original M2 silver combined
PS_m12_refl.gif          - vendor supplied curve of Al/Ag, as measured?
PS_m12_asbuilt.refl      - basically same as PS_m12.refl, as measured?
PS_m12_refl.xv           - JT's tabulation from digitization of PS_m12_refl.gif

Unclear what are the best reflectivities to use, probably the aluminum
from PS_m12_asbuilt.refl, squared for M1 and M2.  Note that there are a
lot of wiggles red of 800nm that probably come from the overcoat, and
these do not appear in the laser-derived Tput, probably because they
are not consistent across the full aperture of M1 and M2.  Also, note that
the aluminum coatings are well below bare aluminum red of 800nm and are
a suspect in the droop of Tput measured response relative to the prediction.
****************************************************************
****************************************************************
On 2009-12-13 Doherty, Stubbs, Keith from NIST, and Tonry used a
tunable laser from NIST and a calibrated photodiode to measure the
full response of the PS1 system, from entrance aperture to detector.
We did not have a means to get an absolute zeropoint, but we think
that the relative measurements are accurate to a few percent.  Each
point is therefore a relative response of the full system less
atmosphere (think of an effective aperture) that should be consistent
for all filters (and no filter, named "o" for open).  The r filter was
remeasured at interleaved wavelengths on the blue side of the bandpass
several times to get a sense of the repeatability.  The throughput
was measured in 7 different annuli with outer radius 3200*r pixels.
In the PS1_trans directory:

laser_091213.throughput  - PS1 effective aperture (arbitrary normalization)

Note that the quotient of filter to open is usually a very good match
to transmissions measured by Barr, but there are definitely some
disagreements, for example Barr shows a much larger change of r filter
response as a function of radius than the laser measurement.

The OTA temperature on that day was about -79C.
****************************************************************
****************************************************************
In the OTA_QE are the QE measurements for each of the 60 OTAs in
GPC1; GPC1_ota.081219 shows the layout.  The *.qe files list
measurements for each cell, the *.qetemp files list the temperature
at the time of measurement.  Since the gain is not easy to measure
to high accuracy on a cell-by-cell basis, there is some variation
in measured QE, so OTA.qe provides a median QE for each OTA, where
all cells are normalized to a QE of 0.97 at 750nm.

Although the OTAs are quite similar, note that the red QE depends on
temperature, and since the OTAs were measured at different
temperatures the red QE's differ a bit.  Also, the Lot 3 OTAs
apparently had a better IILA than Lots 1 and 2, and so have distinctly
higher QE at 400-550nm.

The dependence of red QE on temperature is roughly

  A1 = MAX(0, MIN( 0.001-3.2e-6*(w-950nm), 1e-5*(w-850nm) ) )
  QE = A0 + A1*(T+60C)

In the OTA_QE directory:

OTA.aveqe                - mean OTA QE at -60C (in PS_PRIMARY_PHOT)
OTA_realteal.ar          - reflectivity of OTA surface
GPC1_ota.081219		 - layout of OTAs in GPC1 focal plane
58-Lot-WaferChip.qe      - cell by cell QE measured for OTA
58-Lot-WaferChip.qetemp  - test temperatures
blueqe.png               - dependence of blue QE on Lot number
red.png                  - dependence of red QE on temperature
qe.png                   - tested QE curves
qe-60.png                - tested QE curves, adjusted to -60C
OTA.qe                   - QE measured for each of 60 OTAs in GPC1
****************************************************************
Attachments (8)
-
ps1.zp
(424 bytes
) - added by 16 years ago.
PS1 zeropoints
-
ps1.bandpass
(45.5 KB
) - added by 16 years ago.
Best estimate of PS1 bandpasses
-
ps1.phot
(110.2 KB
) - added by 16 years ago.
Detailed list of various components of PS1 throughput
-
ps1_filt.png
(31.9 KB
) - added by 16 years ago.
PS1 filter transmission curves
-
ps1_trans.png
(34.9 KB
) - added by 16 years ago.
Net PS1 transmission (1.3 airmass)
-
ps1_throughput.png
(39.3 KB
) - added by 16 years ago.
Contributors to PS1 throughput (telescope to detector)
-
starphot.out
(77.5 KB
) - added by 16 years ago.
Synthetic magnitudes in Johnson/KC, SDSS, and Pan-STARRS bandpasses
-
sdss_cmp.png
(25.7 KB
) - added by 16 years ago.
PS1-SDSS colors as a function of (r-i)
Download all attachments as: .zip