| Version 1 (modified by , 14 years ago) ( diff ) |
|---|
This page discusses stacks with an excess in false detections in LAP.ThreePi.20120706
Bill Sweeney
False Detections from y band stacks 2012-12
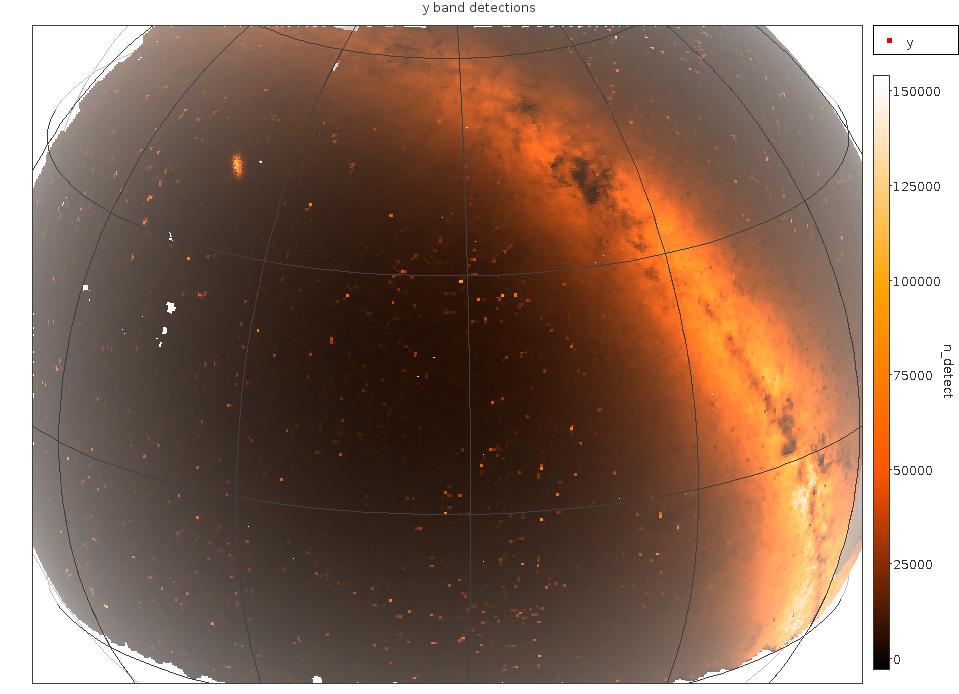
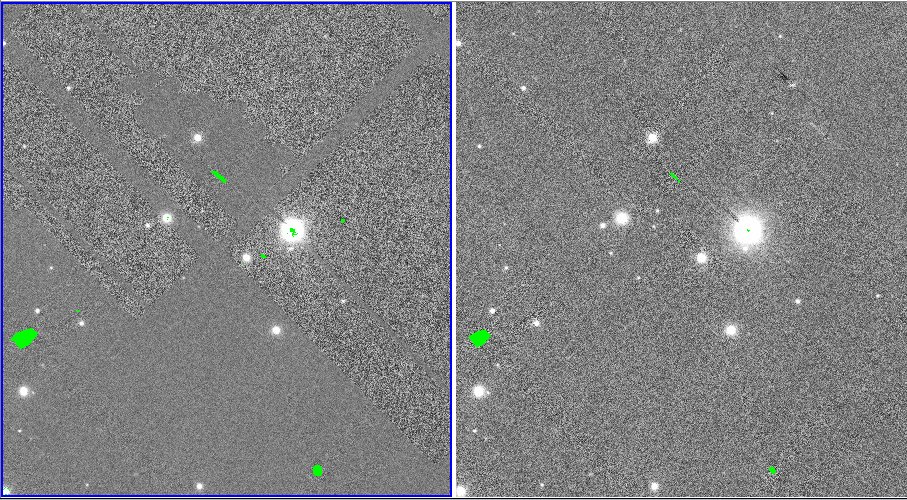
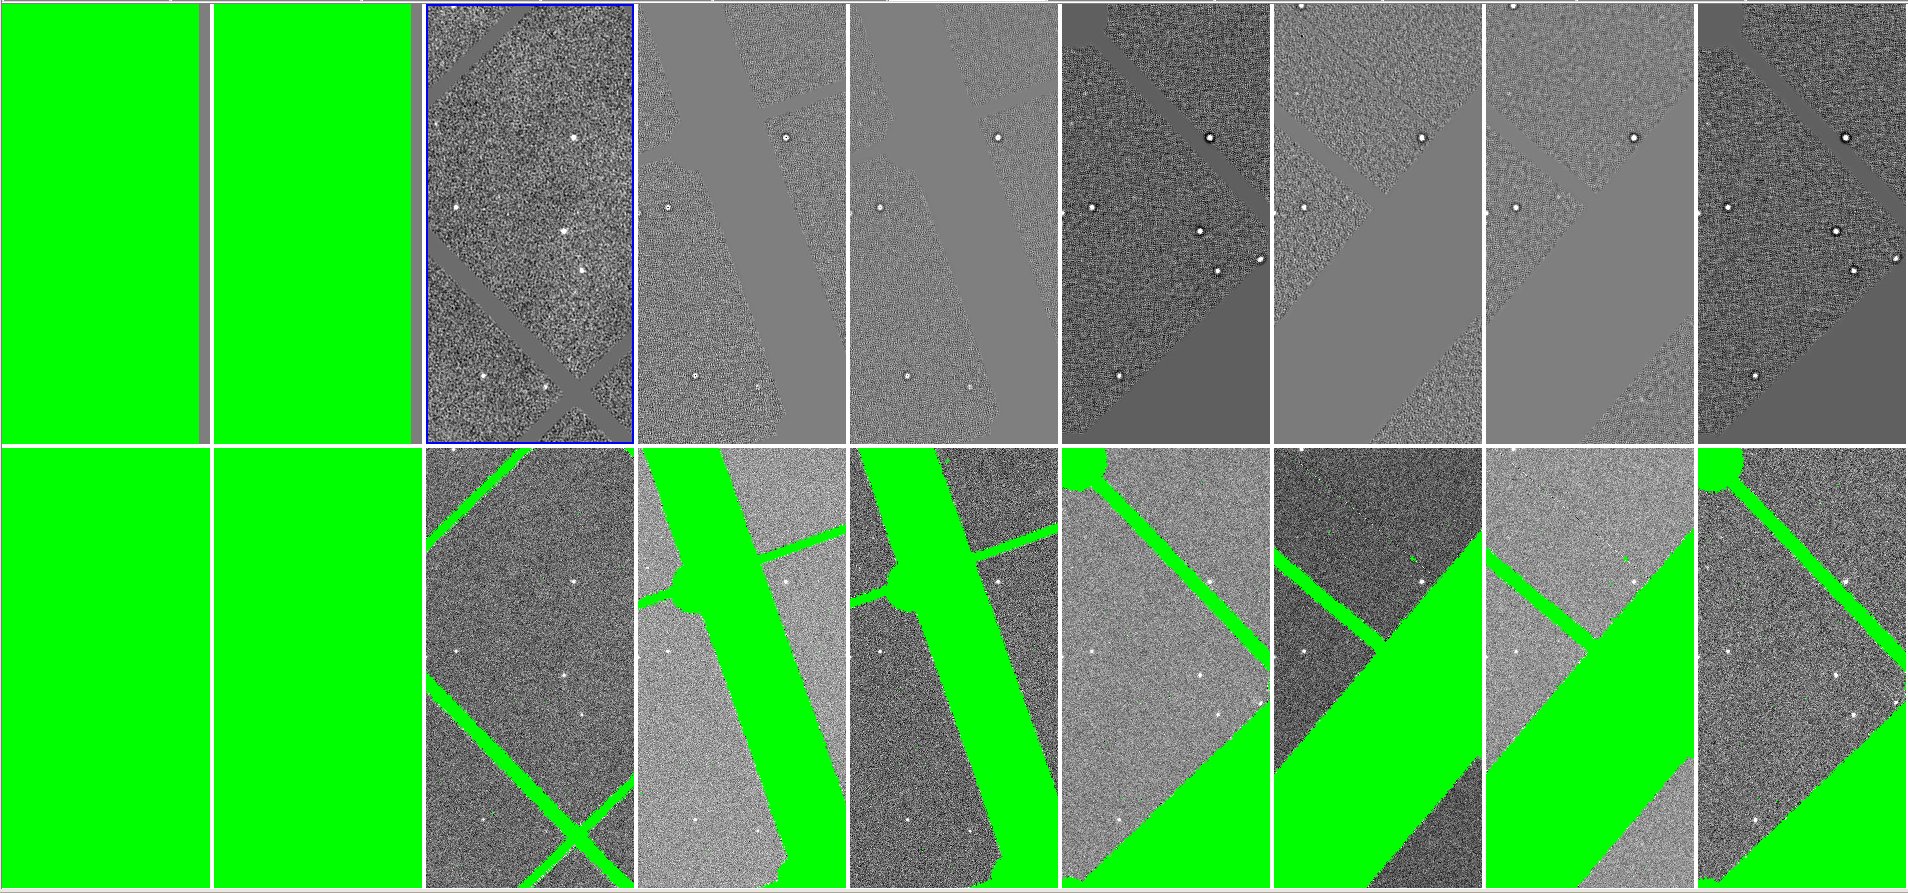
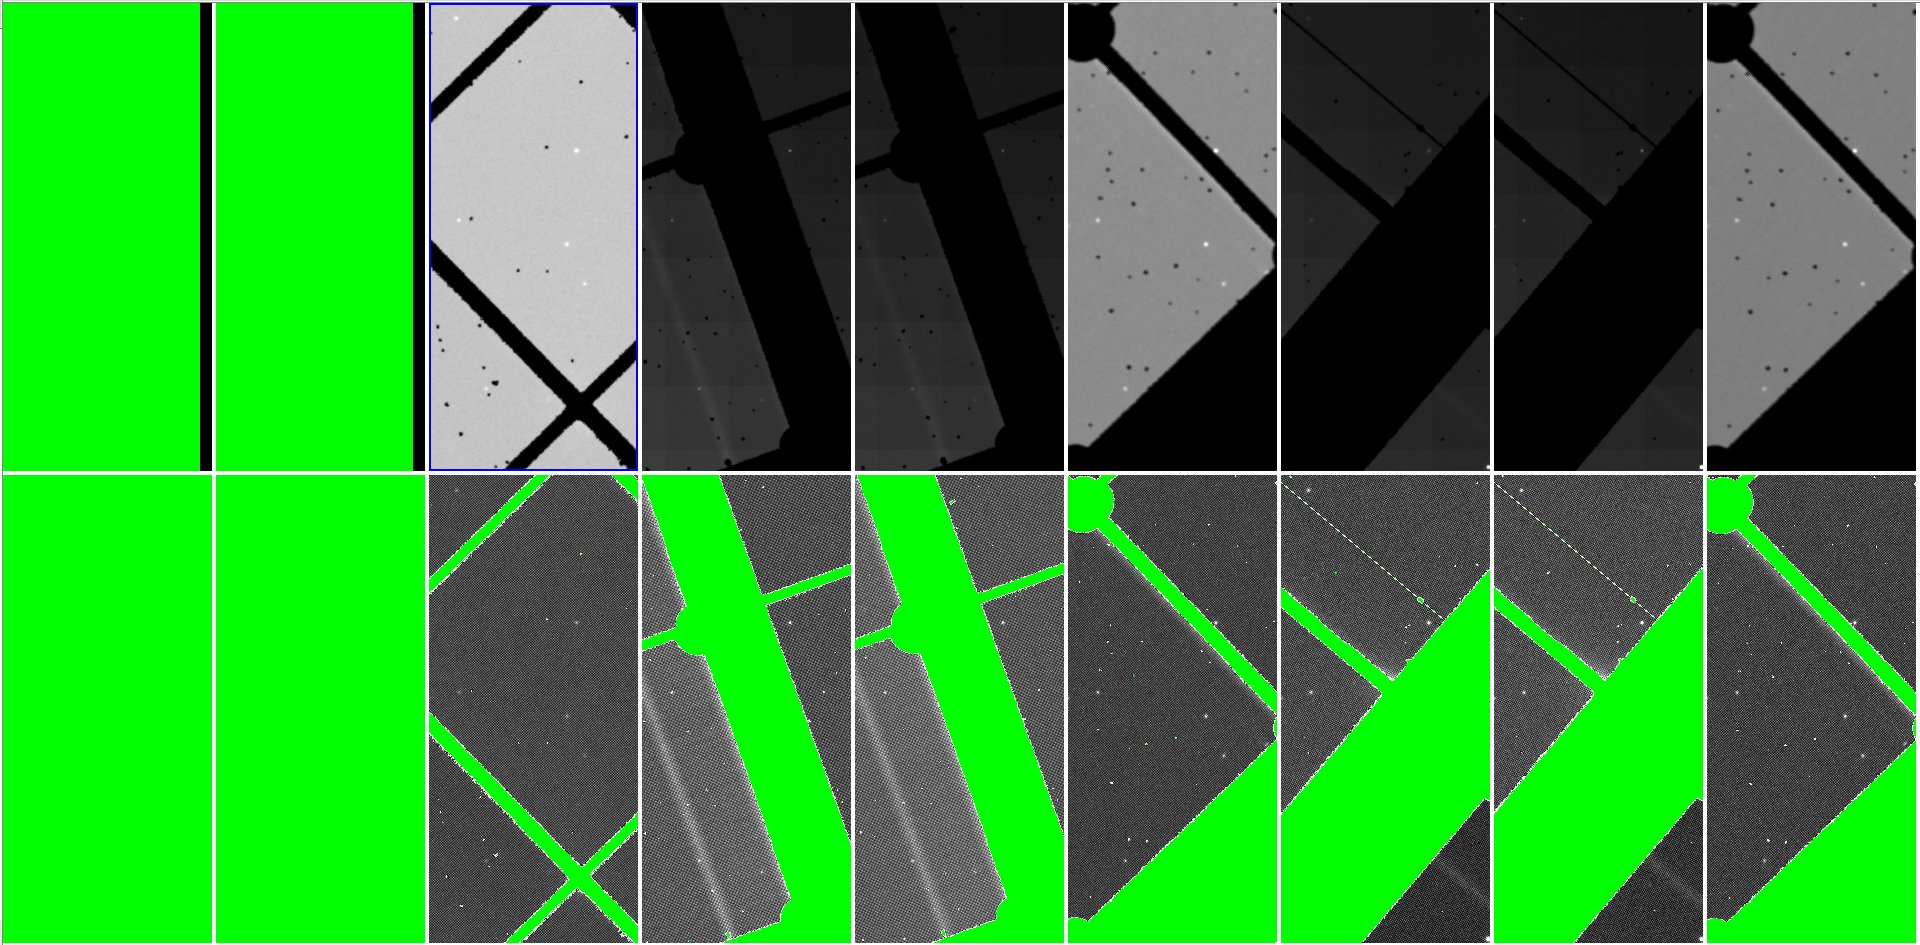
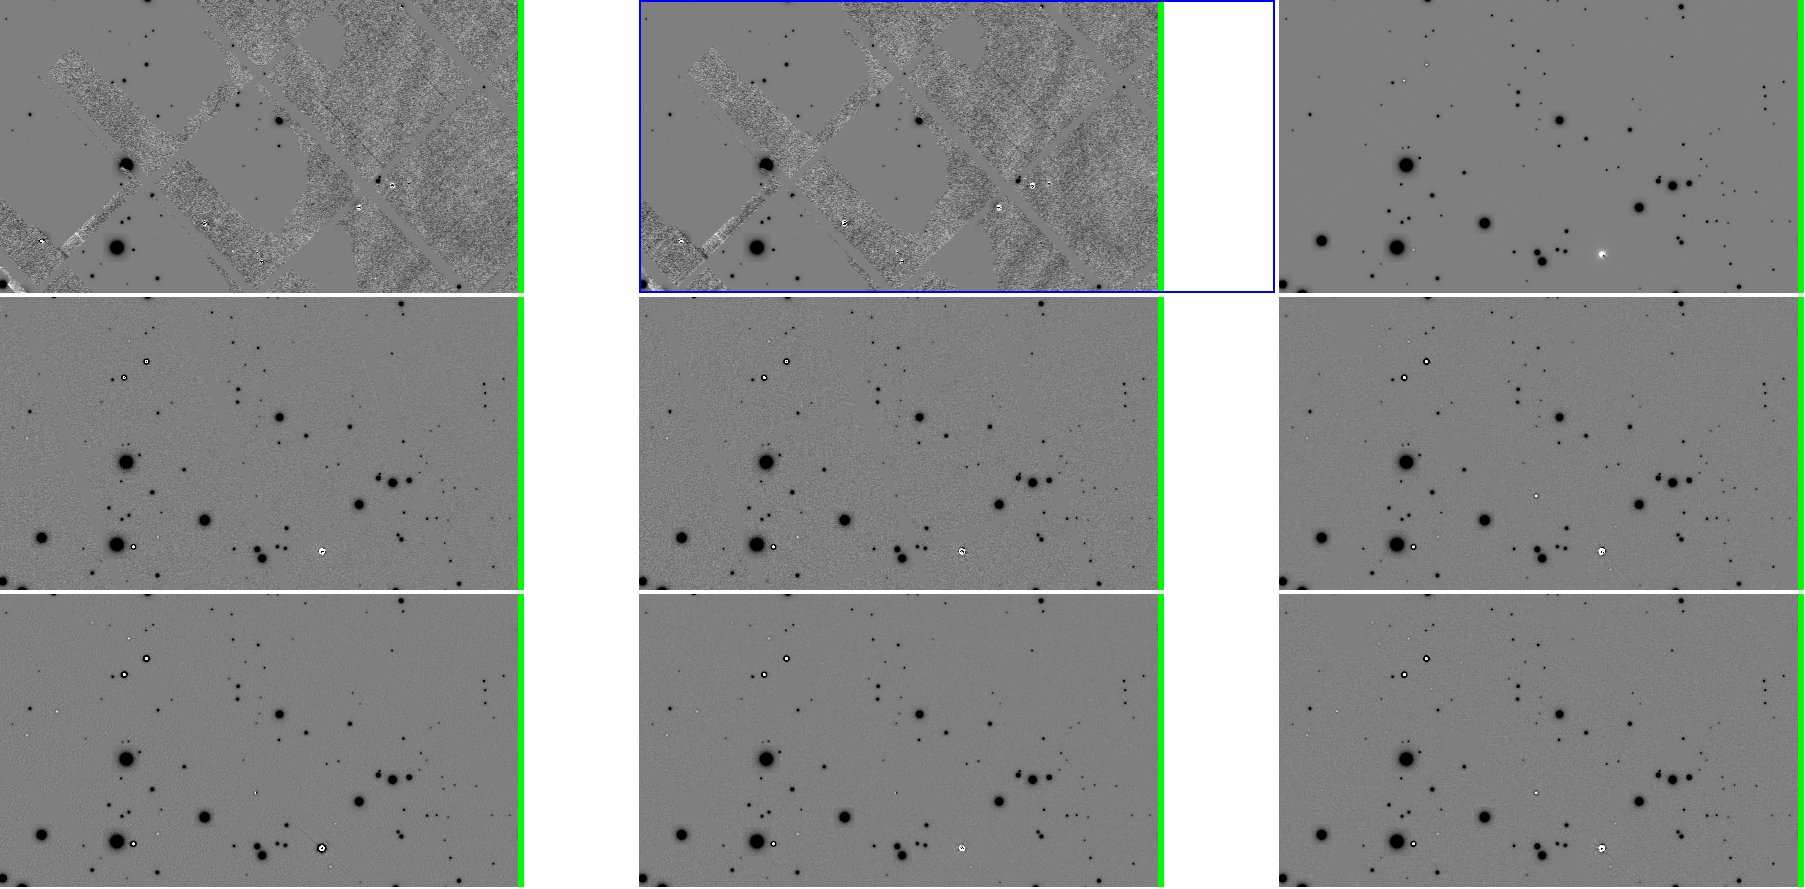
We have noticed that some skycells are getting large numbers of matched (forced photometry) detections. These are caused by false detections in the y band. Recall that forced photometry is performed for all y band sources that are not matched with a detection in another band while detections for the other filters must match 2 other bands before forced photometry is done.
This plot shows the number of matched detetctions in i band verses the number of detected sources in y band.

If we plot the ratio of the number of matched detections to the number of detected sources for each band we can see these outliers.
The following plots shows the ratio for the r band versus that in the ratio in i band for each stack. The plot on the left shows the full range
including the outliers wile the plot on the right zooms in on the values near zero.
The plots for g and z show the same shape while the y band plot does not show the tail.
We propose re-running psphotStack for these skycells changing the rule that matched detections are created for all unmatched y band
detections if some criteria is met. We can get rid of the worst of the outliers with the following cut.
Nmatched_i / NDetected_i > 0.4 && Nmatched_r / NDetected_r > 0.6
This effect is seen in 3% of the skycells north of 30 degrees declination.
After testing a more conservative cut was chosen. It is based on the ratio of the number of sources in y to the number of sources detected in r, i, and z.
Automatic forced photometry for sources detected in y band but not any other is disabled for skycells where
(NDetected_y / NDetected_r) > 1.7 && (NDetected_y / NDetected_i > 1.6) && && (NDetectected_z > 1.65)
About 1 percent of skycells is affected by this feature.
Attachments (14)
- g_detect.jpg (59.4 KB ) - added by 14 years ago.
- y_detect.jpg (63.4 KB ) - added by 14 years ago.
- stk.1714750.jpg (383.0 KB ) - added by 14 years ago.
- input_warps.jpg (306.2 KB ) - added by 14 years ago.
- variance_plot.png (12.2 KB ) - added by 13 years ago.
- example_stack_images.jpg (543.4 KB ) - added by 13 years ago.
- excess_detection_testA.jpg (209.9 KB ) - added by 13 years ago.
- conv_im.jpg (472.8 KB ) - added by 13 years ago.
- conv_var.jpg (326.4 KB ) - added by 13 years ago.
- diff_frame.jpg (243.9 KB ) - added by 13 years ago.
- normalization.jpg (633.4 KB ) - added by 13 years ago.
- normalization2.jpg (470.9 KB ) - added by 13 years ago.
- stacks_noMagCorr.jpg (563.5 KB ) - added by 13 years ago.
- new_variances.png (19.9 KB ) - added by 13 years ago.