| Version 5 (modified by , 17 years ago) ( diff ) |
|---|
DVO Example using the Simtest reference database
(Up to DVO Top Level)
This example uses the simtest reference database (catdir.grizy.simtest). The ptolemy.rc file attached to this page may also be useful.
- Display the area covered by the database:
catdir catdir.synth.simtest/
resize 1000 500
region 180 0 90 ait
cgrid -c red; skycat
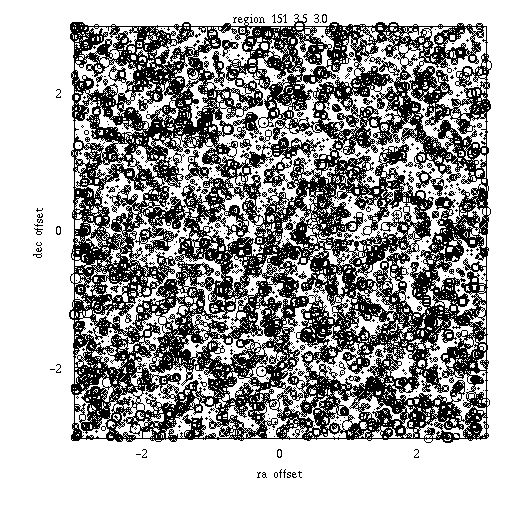
- Zoom in on an area with data:
region 151 3.5 3.0
box
skycat -c red -lw 2
pmeasure -all -m 10 15 -pt 7
label -x "ra offset" -y "dec offset" +x "region 151 3.5 3.0"
png -name sample.region.large.png

- Zoom in on a smaller region
region 151 3.5 0.25
box
pmeasure -all -m 10 15 -pt 7
label +x "region 151 3.5 0.25"
png -name sample.region.small.png

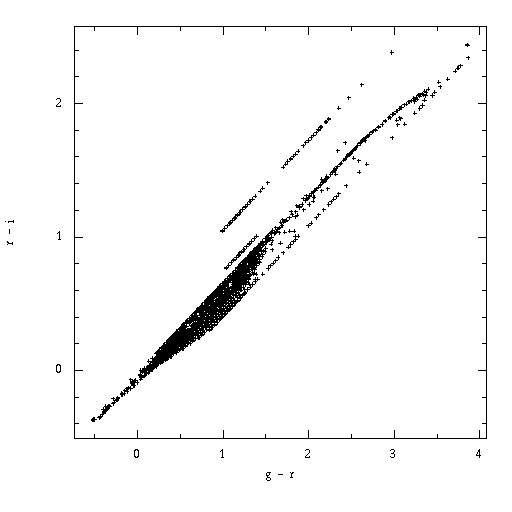
- Make a color-color diagram (average magnitudes)
avextract -region ra, dec, objid, g_SYNTH, r_SYNTH, i_SYNTH, z_SYNTH, y_SYNTH
set gr = g_SYNTH - r_SYNTH
set ri = r_SYNTH - i_SYNTH
lim -n 1 gr ri; clear; box; plot gr ri
label -x "g - r" -y "r - i"
png -name sample.cmd.png

- Extracting data on a specific object (three methods):
gstar -m ra[0] dec[0] 0.001
gstar -m ra[0] dec[0] 0.001 -full
mextract -region RA, DEC, MAG, TIME where ((abs(RA - ra[0]) < 0.001) && (abs(DEC - dec[0]) < 0.001))
Attachments (4)
- sample.cmd.png (4.3 KB ) - added by 17 years ago.
- sample.region.large.png (28.6 KB ) - added by 17 years ago.
- sample.region.small.png (3.0 KB ) - added by 17 years ago.
- ptolemy.rc (2.7 KB ) - added by 17 years ago.
Download all attachments as: .zip
Note:
See TracWiki
for help on using the wiki.