| Version 2 (modified by , 17 years ago) ( diff ) |
|---|
DVO Example using the Simtest reference database
This example uses the simtest reference database (catdir.grizy.simtest). The ptolemy.rc file attached to this page may also be useful.
- Display the area covered by the database:
catdir catdir.synth.simtest/
resize 1000 500
region 180 0 90 ait
cgrid -c red; skycat
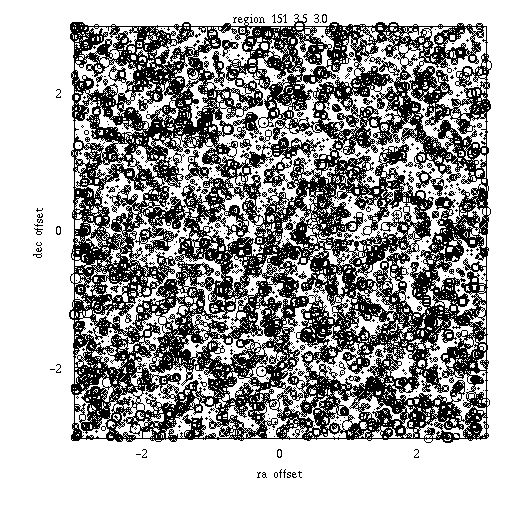
- Zoom in on an area with data:
region 151 3.5 3.0
box
skycat -c red -lw 2
pmeasure -all -m 10 15 -pt 7
label -x "ra offset" -y "dec offset" +x "region 151 3.5 3.0"
png -name sample.region.large.png

- Zoom in on a smaller region
region 151 3.5 0.25
box
pmeasure -all -m 10 15 -pt 7
label +x "region 151 3.5 0.25"
png -name sample.region.small.png
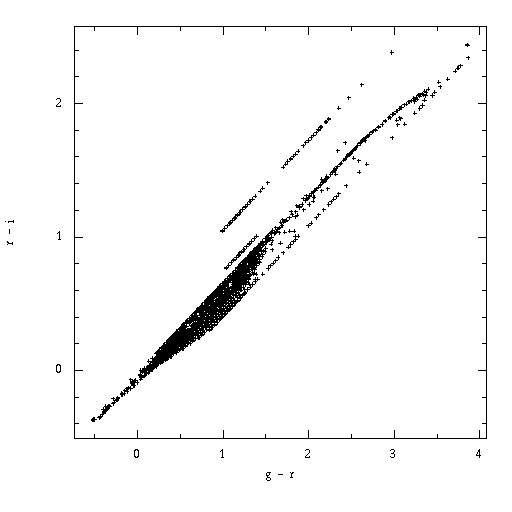
- Make a color-color diagram (average magnitudes)
avextract -region ra, dec, objid, g_SYNTH, r_SYNTH, i_SYNTH, z_SYNTH, y_SYNTH
set gr = g_SYNTH - r_SYNTH
set ri = r_SYNTH - i_SYNTH
lim -n 1 gr ri; clear; box; plot gr ri
label -x "g - r" -y "r - i"
png -name sample.cmd.png
}
[[Image(sample.cmd.png)]]

* Extracting data on a specific object (three methods):
{{{
gstar -m ra[0] dec[0] 0.001
gstar -m ra[0] dec[0] 0.001 -full
mextract -region RA, DEC, MAG, TIME where ((abs(RA - ra[0]) < 0.001) && (abs(DEC - dec[0]) < 0.001))
}}}
Attachments (4)
- sample.cmd.png (4.3 KB ) - added by 17 years ago.
- sample.region.large.png (28.6 KB ) - added by 17 years ago.
- sample.region.small.png (3.0 KB ) - added by 17 years ago.
- ptolemy.rc (2.7 KB ) - added by 17 years ago.
Download all attachments as: .zip
Note:
See TracWiki
for help on using the wiki.